ConPTY Performance in Eclipse Terminal

Background

For many years the Eclipse IDE has provided an integrated terminal (called Eclipse TM Terminal) and now maintained by the Eclipse CDT team. On Windows the terminal uses the amazing WinPTY library to provide a PTY as Windows did not come with one. For the last number of years, Windows 10 has a native version called Windows Pseudo Console (ConPTY) which programs such as VSCode and Eclipse Theia have converted to using, in part because of the fundamental bugs that can’t be fixed in WinPTY. The WinPTY version in Eclipse is also quite out of date, and hard to develop as it is interfaced to by JNI.

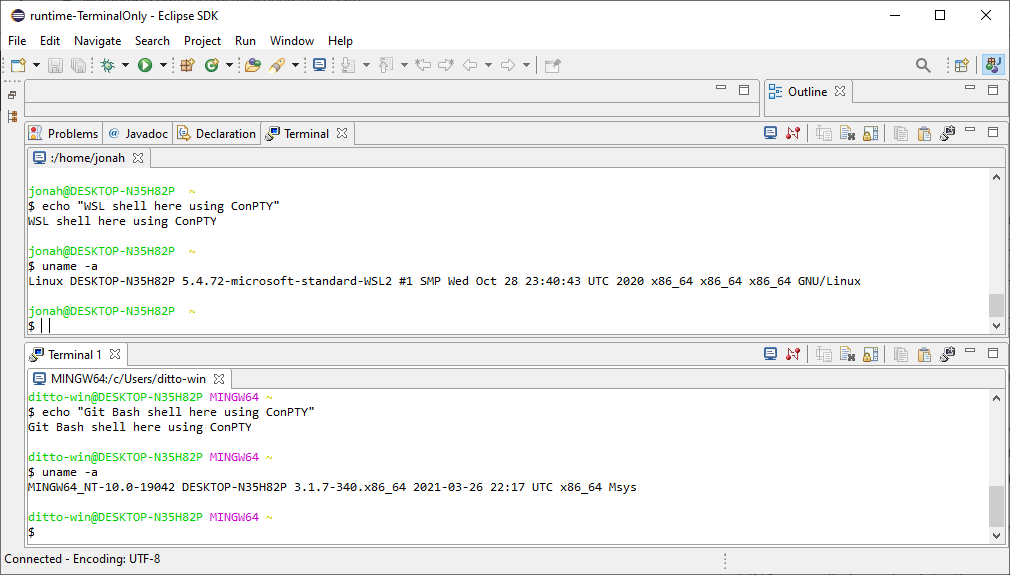
For Eclipse 2021-06 the Eclipse CDT will be releasing a preview version of the terminal that will use ConPTY. For interfacing to ConPTY we are using JNA which is much easier to develop because all the interfacing is in the Java code.

One of the open questions I had was whether there would be a performance issue because of the change to ConPTY. In particular, while JNA is slower for some things the ease of use of JNA normally far outweighs the performance hit. But I wanted to make sure our use case wasn’t a problem and that there wasn’t anything else getting in the way of the terminal’s performance.

Shell to Eclipse Terminal Performance

I have analyzed the performance of a process running in the shell writing to stdout as fast as possible to compare various different terminal options on my Windows machine. The Java program creates a byte[] of configurable size and writes that all to System.out.write() in one go, with some simple wall clock timing around it. See the SpeedTest attachment for the source.

I used 5 terminal programs to test the performance:

  • Windows Command – the classic terminal when you run cmd.exe for example
  • Eclipse with WinPTY
  • Eclipse with ConPTY
  • Windows Terminal (from the people who wrote conpty)
  • VSCode’s integrated terminal using ConPTY

And in each of them I ran the same Java program in 3 different shells:

  • cmd.exe
  • WSL2 running Ubuntu bash
  • git bash

Short summary is that WinPTY and Windows Command are much faster than the rest. ConPTY is quite a bit slower, whether used in Eclipse or Windows Terminal. VSCode is dramatically slower than the rest.

cmd.exeWSL2git bash
Windows Command8.33.54.2
Eclipse with WinPTY12.51.67.7
Eclipse with ConPTY1.81.72.0
Windows Terminal2.22.12.4
VSCode0.80.80.8
Full table of results based on a 10MiB write, reported in MiB/second, rounded to nearest 0.1 MiB/s:

As a comparison, on the same machine dual-booted into Xubuntu 18.04 I ran the following 5 terminals:

  • Eclipse – 23.1 MiB/s
  • VSCode – 3.0 MiB/s
  • xterm – 6.3 MiB/s
  • xfce4-terminal – 10.7 MiB/s
  • gnome-terminal – 10.2 MiB/s

The above shows that the raw speed of Eclipse Terminal is very good, it simply requires the best possible PTY layer to achieve the best speeds.

Eclipse Terminal to Shell Performance

I was going to run an Eclipse -> Shell test to make sure writes to the terminal hadn’t regressed. However the terminal has an artificial throttle in this path that limits performance to around 0.01 MiB/s, plenty fast to type, but much slower than a performant system could be. The code could probably be revisited because presumably the new ConPTY does not suffer from these buffering issues, and the throttling probably should not be there for non-Windows at all.

Conclusion

I am pleased that the performance of ConPTY with JNA is close to the new dedicated Microsoft Terminal and much faster than VSCode. Therefore I plan to focus my time on other areas of the terminal, like WSL integration and bug fixes with larger impacts. I am grateful to the community’s contributions and I will happily support/test/integrate any improvements, such as the upcoming Ctrl-Click functionality that was contributed by Fabrizio Iannetti and will be available in Eclipse IDE 2021-06.

Because much of the performance slowdown is because of ConPTY itself, which is actively being developed at Microsoft I hope that Eclipse will benefit from those performance improvements over time. There is no plan to remove the WinPTY implementation anytime soon, so if there is a user who feels impacted by the slowdown I encourage them to reach out to the community (cdt-dev mailing list, tweet me, comment on this bug or create a bug report).

Rethinking Developer Tools & the Future of IDEs

canihaz

I always want more time in my day. And that’s because I waste all my time trying to think of new ways that would save me time. Which brings me to Github pull requests. One thing I often wish for when reviewing a Github PR: why can’t I quickly jump to the definition of a method being used? Or see where else that piece of code is being called from? Some quick code navigation features would help me do reviews better and quicker. I’ve been spoilt on code completion features in Eclipse IDE and now I want them everywhere. Luckily I get to be in a position I can aim to make that happen.

In thinking about how we can make developer tools and features ubiquitous, I came up with my latest talk: the future of IDEs. I first did this talk within the Internet of Things domain at Thingmonk and had some great feedback.  James Governor of Redmonk had this to say about it:

Tracy Miranda, founder of Kichwa Coders, gave us a whistlestop tour of the future of dev tools for IoT. Miranda is a fixture in the Eclipse community, but did a great job of laying out the tools landscape. And of course Microsoft Visual Studio Code got a favourable mention (so much love out there for Code right now, it’s the modern goldilocks text editor). That said, for programming digital twins, she argued we’re going to need visual tools and models, beyond a text editor. Node-Red of course also got a mention.

This talk covers everything from the massive fragmentation with languages and frameworks to making our developer tools more visual, smarter and really so they work everywhere. Even in Github PRs. If you work in developing tools or have strong opinions about how developer tools should work, then this talk is a must watch.

After Thingmonk and the great feedback, I got to refine the talk and present it at Jax London as the ‘Future of IDEs‘. That talk wasn’t recorded but we did manage to have a quick chat about it afterwards, check out the short version (+ extras) here:

The Future of Developer Tools for IoT, ThingMonk 2017

ThingMonk is an annual London conference that brings together the people building and shaping the Internet of Things. This year I spoke at the conference on ‘The Future of Developer Tools for IoT’. This talk looks at emerging and future trends in the developer tools space. Check out the slides and feedback from the audience, as well as reference links at the end. Plus thanks to Marcel Bruch & Codetrails for input on AI tools. Be sure to share your thoughts on how you see developer tools shaping up to scale for building the Internet of Things.

Continue reading “The Future of Developer Tools for IoT, ThingMonk 2017”

GDB’s MI is not a Debug Protocol

While looking to the future of debugger tooling, it is still important to consider the prior art and the solutions that have stood the test of time. For embedded development, gdb is high on that list, so it is worth considering if gdb’s interface could be the basis of a debug protocol.

If you’ve used gdb to debug C/C++ code then you are probably aware of MI, the machine interface layer used to communicate between the debugger backend and the IDE front end. MI is not only used by gdb but also adopted by lldb (the defacto debugger for Swift) and more recently by clrdbg (.NET Core). MI defines a rich set of functionality from standard debug run control and breakpoints up to advanced features for multi-process debug, reverse debugging and dynamic printf. With MI being pretty pervasive and supporting such rich functionality, it is tempting to think it might make the basis of a good debug protocol.  However in practice it lacks some of the qualities of a good protocol:

1. A Specification

We once had the opportunity to work on a project where the brief was to integrate into Eclipse IDE/CDT a custom debugger that ‘implemented the MI spec’. We can tell you we learnt the hard way that MI has plenty of useful documentation but no spec to speak of. This matters when you get into the nitty gritty of implementation details for example: what syntax should be used to notify when a bad condition has been created on a breakpoint?

The documentation does not necessarily reflect what the code does, some command or command variants have inconsistencies with the source code or don’t reflect platform dependent issues. For example, the -exec-step-instruction in practice takes an argument (e.g -exec-step-instruction 1)  even though this is not documented.

The main message here is documentation, even good documentation as in the case of gdb, is not the same as a protocol specification, so one can’t blindly implement to the docs (and if you think it’s just a case of looking at the code… well, which version?- see #4 below).

2. Clean Interfaces with no Idiosyncrasies

This piece of code from Visual Studio’s MIEngine demonstrates how rife MI is with idiosyncrasies. The code launches a debugger which will use MI to communicate i.e. to gdb, lldb or clrdbg. There are special cases for each tool that an IDE just shouldn’t need to know about:

  • Different ways of specifying a working directory depending on the tool
  • Environment variables are set differently: before launch for gdb/lldb after for clrdbg
  • Details of which Operating System the debugger is being run on

miengine

And this is even before you launch MI. In Eclipse CDT just after launching MI, the IDE has to know about and issue commands about all sorts of things e.g. ‘set print sevenbit-strings on’ c’mon, really, seriously?  Tom sums it up nicely:

It is an oddity that currently an MI consumer must check gdb’s host charset in order to know how to decode its output.

Once you get into actual debugging there’s a fair amount of ‘need-to-know’ for special cases & exceptions. A protocol needs to steer-clear of implementation details, but in the case of MI these have all too often leaked in.

3. Fit for Purpose

As MI was not specifically designed to be a protocol,  not suprisingly there are a few behaviour specific things that make it not fit to be a protocol. For example:

  • If your program prints to stdout, then that can corrupt the output stream of MI, breaking the instructions.
  • In some cases GDB responds twice from a single command. In such cases, for example Eclipse CDT has a special MIAsyncErrorProcessor class just to manage such cases.

4. Versioning

A good protocol has defined versions that clients and subscribers can adapt to.  With each new version of GDB,  MI has subtle differences that make client implementation long-winded and difficult to maintain. For example, in Eclipse CDT’s gdb debugger implementation (DSF) separate classes are created to manage differences in MI in different versions of gdb.  There are 5 different breakpoint classes, 7 different run control classes, etc And this is just gdb versions, let alone lldb or clrdb – imagine trying to implement wide-scale support for all those in a new IDE!

debug_versions

Conclusion

While feature-rich and ubiquitous, gdb’s MI is a reasonable syntax, but not a good debug protocol.  A good protocol needs much more than that – clean interfaces, fit for purpose, a spec & versioning – if it is really going to make common debugger implementations easier.

What can Eclipse developers learn from Team Sky’s aggregation of marginal gains?

The concept of marginal gains, made famous by Team Sky, has revolutionized some sports. The principle is that if you make 1% improvements in a number of areas, in the long run the cumulative gains will be hugely significant. And in that vein, a 1% decline here-and-there will lead to significant problems further down the line.

So how could we apply that principle to the user experience (UX) of Eclipse C/C++ Development (CDT) tools? What would happen if we continuously improved lots of small things in Eclipse CDT? Such as the build console speed? Or a really annoying message in the debugger source window? It is still too soon to analyse the impact of these changes but we believe even the smallest positive change will be worth it. Plus it is a great way to get new folks involved with the project. Here’s a guest post from Pierre Sachot, a computer science student at IUT Blagnac who is currently doing open-source work experience with Kichwa Coders. Pierre has written an experience report on fixing his very first CDT UX issue.

Context

This week I worked with Yannick on fixing the CDT CSourceNotFoundEditor problem – the unwanted error message that Eclipse CDT shows when users are running the debugger and jumping into a function which is in another project file. When Eclipse CDT users were running the debugger on the C Project, a window was opening on screen. This window was both alarming in appearance and obtrusive. In addition, the message itself was unclear. For example, it could display “No source available for 0x02547”, which is irrelevent to the user because he/she does not have an access to this memory address. Several users had complained about it and expressed a desire to disable the window (see: stack overflow: “Eclipse often opens editors for hex numbers (addresses?) then fails to load anything”). In this post I will show you how we replaced CSourceUserNot FoundEditor with a better user experience display.

Continue reading “What can Eclipse developers learn from Team Sky’s aggregation of marginal gains?”